Quickstart
Five minutes to your first publication-ready figure.
Complete example
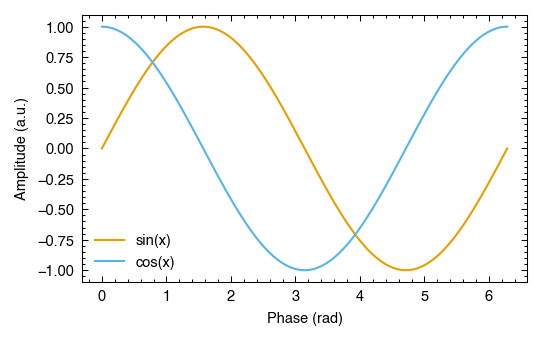
Copy this, run it, and you have a Nature-ready PDF:
import numpy as np
import plotstyle

with plotstyle.use("nature") as style:
    fig, ax = style.figure(columns=1)

    x = np.linspace(0, 2 * np.pi, 200)
    ax.plot(x, np.sin(x), label="sin(x)")
    ax.plot(x, np.cos(x), label="cos(x)")
    ax.set_xlabel("Phase (rad)")
    ax.set_ylabel("Amplitude (a.u.)")
    ax.legend()

    style.savefig(fig, "figure1.pdf")
Output: figure1.pdf at 300 DPI with TrueType fonts embedded, sized to Nature’s single-column width (89 mm).
What each call does
plotstyle.use("nature")
Applies Nature’s formatting requirements to Matplotlib: font family, font sizes, minimum line weight, DPI, and the Okabe-Ito color palette as the default color cycle. Returns a JournalStyle object.
The context manager restores all Matplotlib settings when the block exits, so your session is not affected:
with plotstyle.use("nature") as style:
    ...  # Matplotlib is configured for Nature here
# Matplotlib is back to its original settings here
style.figure(columns=1)
Creates a figure at the journal’s exact column width. No need to look up measurements.
columns=1: single-column width (89 mm for Nature)columns=2: full text width (183 mm for Nature)
Returns (fig, ax), the same as plt.subplots().
style.savefig(fig, "figure1.pdf")
Saves the figure with TrueType font embedding (fonttype=42) and the journal’s minimum DPI enforced. Drop-in replacement for fig.savefig().
Multi-panel figures
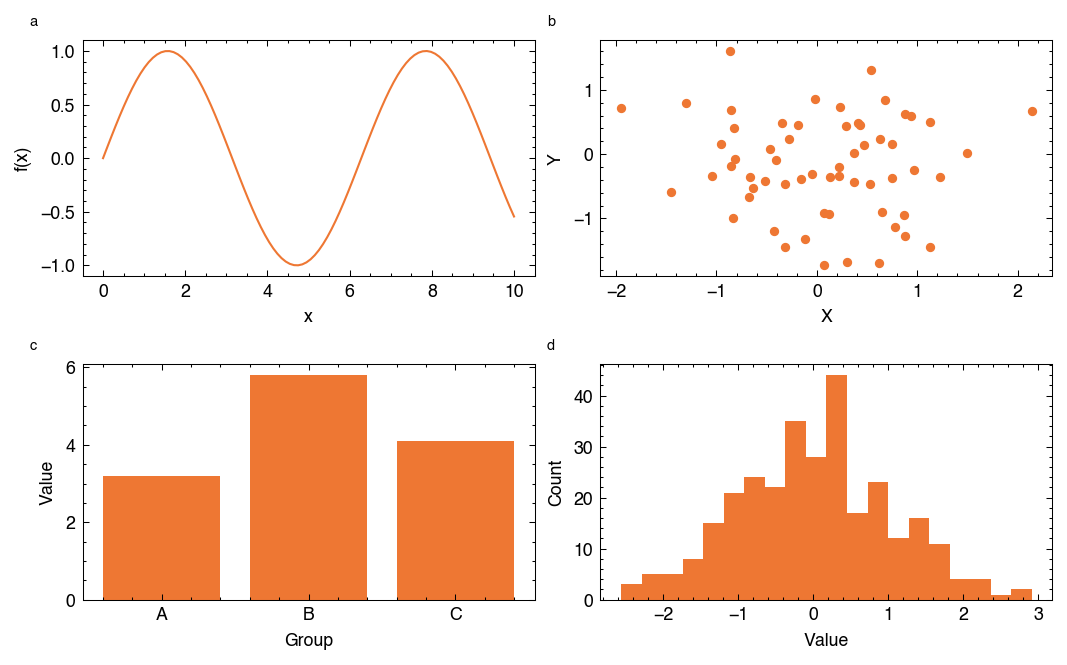
Use style.subplots() for layouts with multiple panels. Panel labels (a, b, c, d) are added automatically in bold lowercase, matching the format used by Nature, Science, and most other journals:
import numpy as np
import plotstyle

rng = np.random.default_rng(42)

with plotstyle.use("science") as style:
    fig, axes = style.subplots(nrows=2, ncols=2, columns=2)

    x = np.linspace(0, 10, 100)
    axes[0, 0].plot(x, np.sin(x))
    axes[0, 0].set_xlabel("x")
    axes[0, 0].set_ylabel("f(x)")

    axes[0, 1].scatter(rng.normal(size=60), rng.normal(size=60), s=12)
    axes[0, 1].set_xlabel("X")
    axes[0, 1].set_ylabel("Y")

    axes[1, 0].bar(["A", "B", "C"], [3.2, 5.8, 4.1])
    axes[1, 0].set_xlabel("Group")
    axes[1, 0].set_ylabel("Value")

    axes[1, 1].hist(rng.normal(size=300), bins=20)
    axes[1, 1].set_xlabel("Value")
    axes[1, 1].set_ylabel("Count")

    style.savefig(fig, "figure2.pdf")
Color palettes
plotstyle.use() sets the journal’s recommended palette as the default color cycle automatically. Plots draw from it without any color= argument:
import numpy as np
import plotstyle

x = np.linspace(0, 6, 100)

with plotstyle.use("nature") as style:
    fig, ax = style.figure(columns=1)
    for i in range(4):
        ax.plot(x, np.sin(x + i * 0.5), label=f"Series {i + 1}")
    ax.set_xlabel("x")
    ax.set_ylabel("y")
    ax.legend()
    style.savefig(fig, "figure3.pdf")
Each journal has its own recommended palette. Here is how the built-in palettes compare across journals:
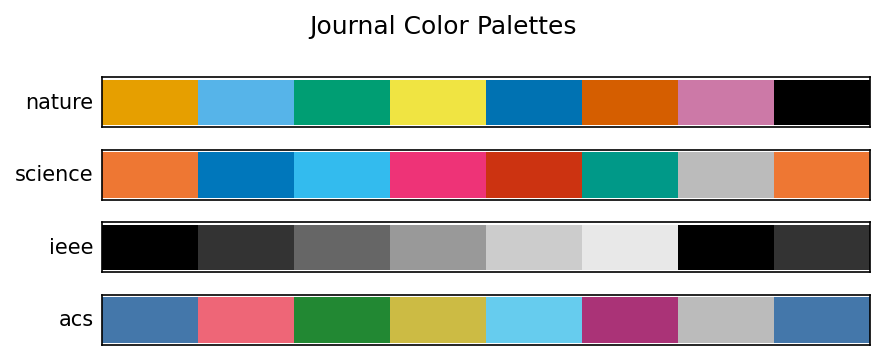
When you need the color values directly (for scatter plots, bar charts, or custom legend patches), use style.palette():
colors = style.palette(n=4)
# ['#E69F00', '#56B4E9', '#009E73', '#F0E442']
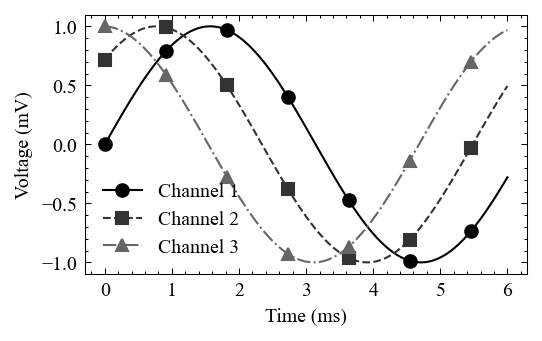
For journals that require grayscale-safe figures (such as IEEE), use with_markers=True to get a distinct color, linestyle, and marker for each series:
import numpy as np
import plotstyle

x = np.linspace(0, 6, 100)

with plotstyle.use("ieee") as style:
    fig, ax = style.figure(columns=1)
    styled = style.palette(n=3, with_markers=True)
    for i, (color, linestyle, marker) in enumerate(styled):
        ax.plot(
            x, np.sin(x + i * 0.8),
            color=color, linestyle=linestyle,
            marker=marker, markevery=15,
            label=f"Channel {i + 1}",
        )
    ax.set_xlabel("Time (ms)")
    ax.set_ylabel("Voltage (mV)")
    ax.legend()
    style.savefig(fig, "figure4.pdf")
Validate before submitting
style.validate() checks your figure against the journal’s requirements: dimensions, font sizes, line weights, and color rules. Run it before exporting:
report = style.validate(fig)
print(report)           # formatted table of all checks
print(report.passed)    # True if no failures
print(report.failures)  # list of checks that failed, with fix suggestions
print(report.warnings)  # list of checks that passed with a warning
Export for submission
style.export_submission() saves the figure in every format the journal accepts (PDF, TIFF, EPS, etc.) in one call:
style.export_submission(fig, "fig1", output_dir="submission/")
Next steps
Concepts: understand how presets, overlays, and context managers work
Examples: 18 runnable scripts covering the full feature set
User Guide: deep dives into overlays, accessibility, validation, and migration
API reference: complete function and class documentation
Supported journals: per-journal specifications and column widths